Patterns of Technical Analysis: A Pennant
Before discussing the patterns of cryptocurrency market charts, we suggest recalling what technical analysis is. So, technical analysis is basically the process of analyzing and monitoring crypto market charts in order to determine and predict the dynamics of asset prices. Another important term on the topic is an up or down trend. The trend lines are horizontal lines that connect points on a chart. Thanks to these lines, it is easier for a trader to determine the future direction of the price, or the trend.
The technical analysis patterns are geometric shapes that one can determine in certain parts of the chart. If a trader finds this figure on the chart, it will be easier for them to predict further price direction or enter into a deal. Usually, at the end of the formation of the figure, when the price goes beyond its limits, the trader receives a signal that it is possible to make a deal. Technical analysis figures are traditionally divided into three categories:
- figures of the trend continuation – the ones that indicate that the trend will continue;
- reversal figures – the patterns showing the upcoming reversal of the trend;
- bilateral figures – ambiguous figures which may indicate price movement both up or down.
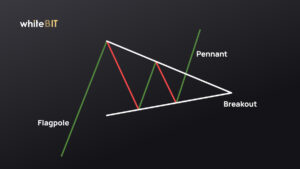
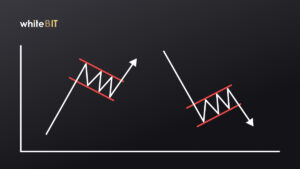
A pennant is a trend continuation pattern, which is a triangle located horizontally. It is formed with a significant price movement up or down and ends the formation with a decrease in the dynamics. After that, the trend continues to move up or down. There is a bullish pennant, which indicates the continuation of the uptrend, and a bearish pennant, which predicts the continuation of the downward price movement.
The pennant consists of the following features:
- a flagpole, the initial strong move, which becomes the basis of the triangle;
- breakout levels, representing the point at the end of the flagpole and the point of consolidation of the entire figure, after which the trend continues;
- the pennant, which is the triangle itself that forms between the flagpole and the second breakout point.
The pennant pattern resembles another pattern that occurs before the continuation of the trend – the flag. The main difference is that the lines of the flag are parallel to each other without narrowing.
Technical analysis involves studying a number of key figures. The ability to recognize this or that figure on the chart helps the trader predict the market movement and evaluate all the opportunities and risks.